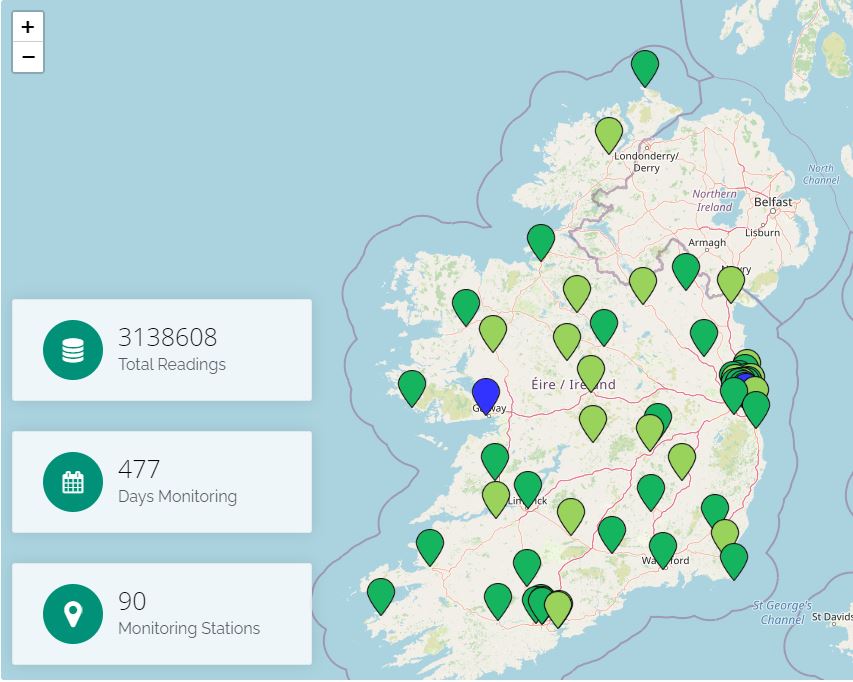
The air-quality map colour-codes the readings from the air quality monitoring stations in Ireland. The map can be viewed at: https://www.airquality.ie
The readings are based on the current air quality index (1 to 10) as it relates to health. This is called the Air Quality Index for Health (AQIH) status. The monitoring stations map updates at least once an hour.
The air quality readings are colour-coded from 1 being good (light green) to 10 being very poor (purple).
Green is good
Typically, most air quality monitoring stations are green. This shows the quality of the air is good.
Blue means no automatic update available in this area
If a station is blue, it means that it does not update data automatically. Instead, the air quality reading must first be analysed in a laboratory before we can report on air quality.
Grey means information not available at this time
If a station is displayed in grey on the map there may be:
- an instrument or communication issue at the monitoring station, or
- planned maintenance or upgrade taking place.
You can see all EPA air quality reports and the latest air quality bulletin in our Reports and Bulletins.
Access a list of all the monitoring stations.
This map also presents the twice daily updated Air Quality Forecast maps. These show the expected air quality for:
- today,
- tomorrow, and
- the day after tomorrow.