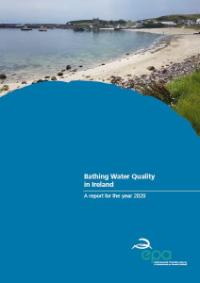
Bathing Water Quality in Ireland 2020
A report for the year 2020, May 2021
Year: 2021
The 2020 EPA Bathing Water report sets out bathing water quality at Ireland's beaches during the summer 2020 bathing water season.
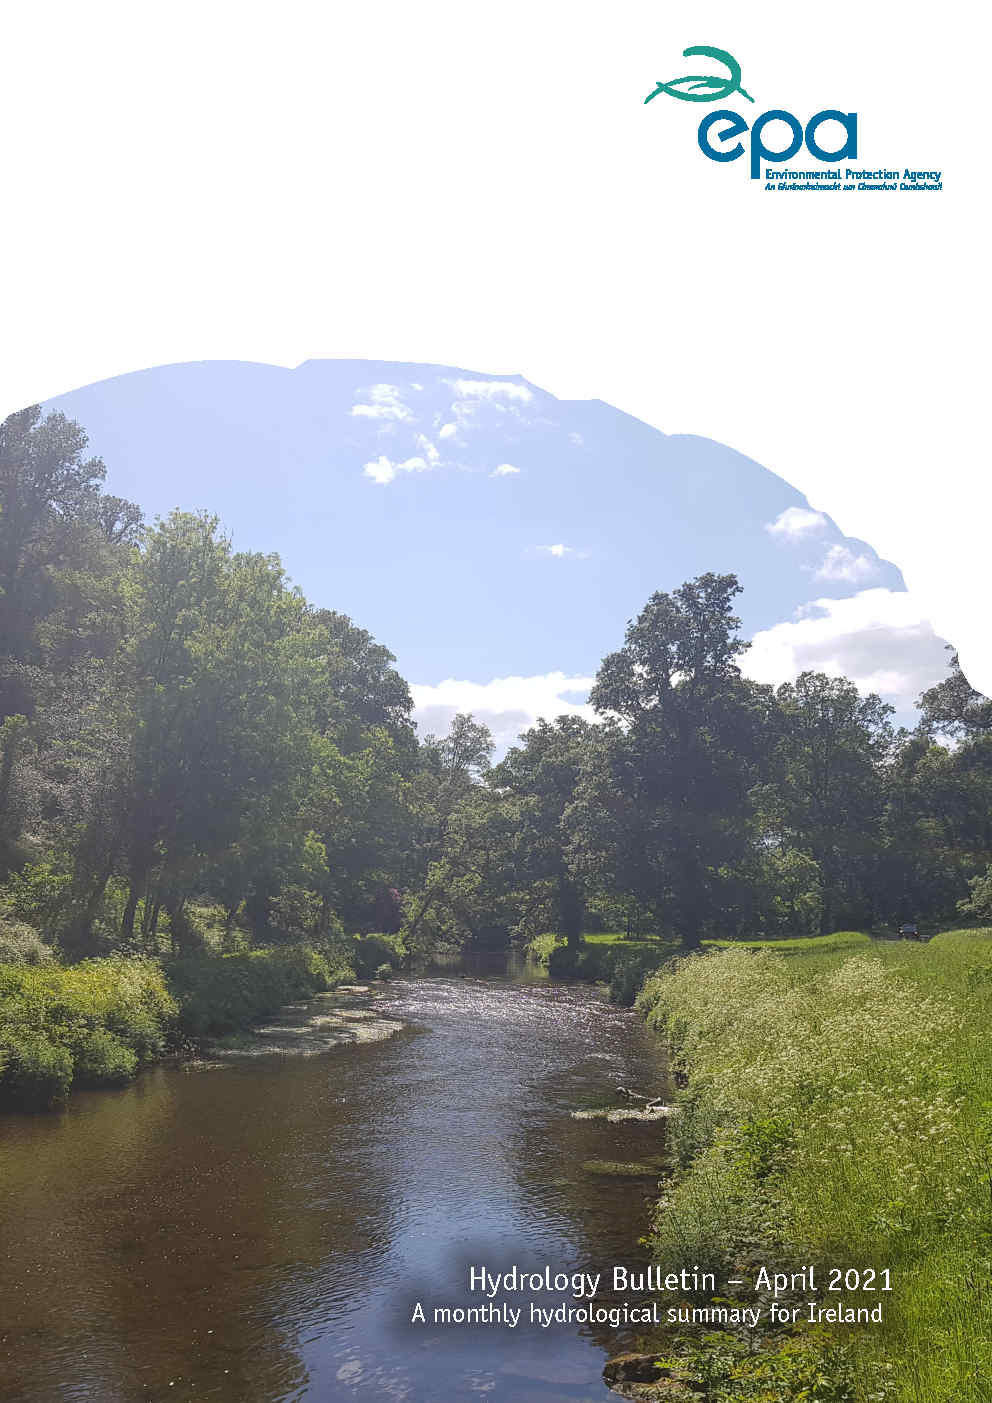
Hydrology Summary Bulletin - April 2021
Hydrology bulletin on rainfall, river flows, lake levels, groundwater levels and spring outflows for April 2021, May 2021
Year: 2021
Hydrology Summary Bulletin for April 2021 outlining the flows in rivers, rainfall, lake levels, groundwater levels and spring outflows of over 300 stations across Ireland
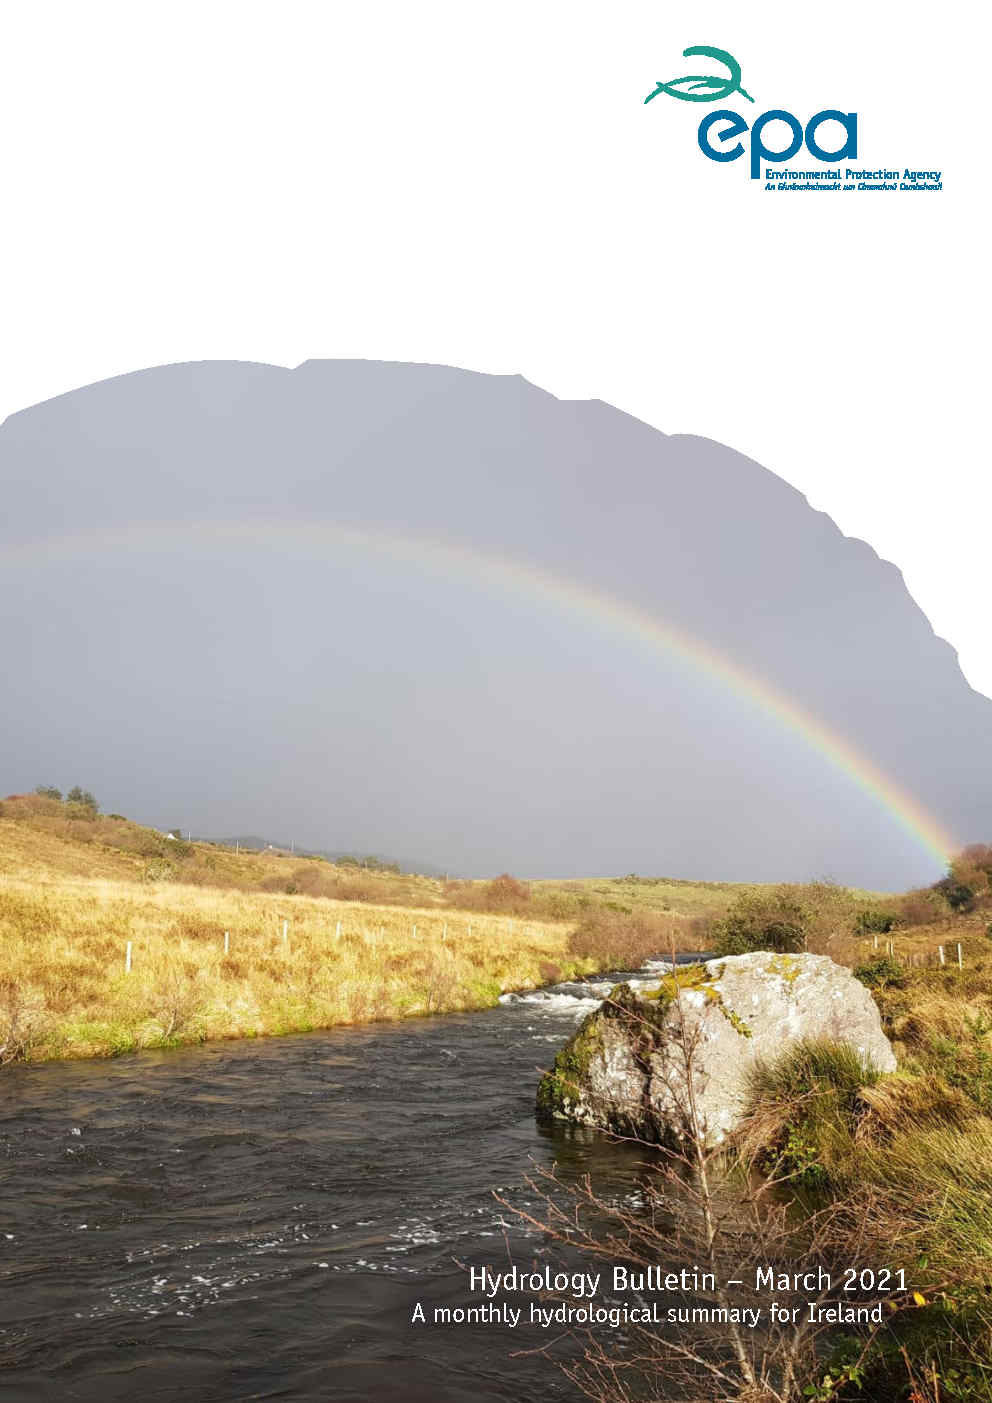
Hydrology Summary Bulletin - March 2021
Year: 2021
Hydrology Summary Bulletin for March 2021 outlining the flows in rivers, rainfall, lake levels, groundwater levels and spring outflows of over 300 stations across Ireland.

River Monitoring – Aquatic Invertebrates
Year: 2021
This plain English factsheet outlines the work done by the EPA monitoring aquatic invertebrates in our rivers.
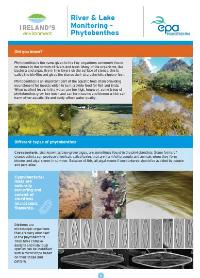
River and Lake Monitoring - Phytobenthos fact sheet
Year: 2021
This plain English factsheet outlines the work done by the EPA in monitoring phytobenthos in rivers and lakes.
Lake Monitoring Phytoplankton fact sheet
Year: 2021
This plain English fact sheet outlines the work done by the EPA in monitoring phytoplankton in lakes.
Hydrology Summary Bulletin - February 2021
Year: 2021
Hydrology Summary Bulletin for February 2021outlining the flows in rivers, rainfall, lake levels, groundwater levels and spring outflows of over 300 stations across Ireland.

Ireland's National Water Framework Directive Monitoring Programme, 2019-2021
Year: 2021
This document presents Ireland’s national WFD monitoring programme for surface and groundwater bodies.
Hydrology Summary Bulletin - January 2021
A bulletin on rainfall, river flows, lake levels, groundwater levels and spring outflows. , February 2021
Year: 2021
The majority of meteorological stations recorded monthly rainfall totals above their long-term average for January. It was wettest in the west, south west, north west and the Wicklow Uplands. River flows remained high in the west, north east and east of the country with average monthly flows above normal or particularly high at 47% of sites analysed.
Hydrology Summary Bulletin - December 2020
Year: 2021
Hydrology Summary Bulletin for December 2020 outlining the flows in rivers, rainfall, lake levels, groundwater levels and spring outflows of over 300 stations across Ireland
Hydrology Summary Bulletin - November 2020
Year: 2020
Hydrology Summary Bulletin for November 2020 outlining the flows in rivers, rainfall, lake levels, groundwater levels and spring outflows of over 300 stations across Ireland
Nitrate Directives Article 10 Report for Ireland for the Period 2016-2019
Council Directive of 12 December 1991 concerning the protection of waters against pollution caused by nitrates from agricultural sources (91/676/EEC), December 2020
Year: 2020
This report provides the information from Ireland to the European Commission, as required under Article 10 of the Nitrates Directive (91/676/EEC), with respect to the seventh reporting period (2016-2019). The report comprises: a description, with maps, of the evolution of water quality in groundwater and surface waters; a statement on the adoption of a Whole Territory Approach with respect to the designation of nitrate vulnerable zones; a summary of agricultural activities and an account of the implementation of the agricultural Code of Good Practice and a summary of the principal measures and an evaluation of the National Action Programme for limiting nitrate inputs from agricultural sources.
Hydrology Summary Bulletin - October 2020
Year: 2020
Hydrology Summary Bulletin for October 2020 outlining the flows in rivers, rainfall, lake levels, groundwater levels and spring outflows of over 300 stations across Ireland

Intercalibration of the Lake Acidification Macroinvertebrate Metric (LAMM) in Ireland
Year: 2020
This report was submitted to the European Commission and shows how Ireland intercalibrated the UK developed classification tool, Lake Acidification Method Metric (LAMM) for the pressure acidification in the Irish situation using Irish lake invertebrate data. It shows how Ireland successfully intercalibrated the class boundaries of the LAMM adapted for the Irish situation using IE Data with those agreed in the Northern Geographical Intercalibration Group N-GIG intercalibration exercise following the Common Implementation Strategy Guidance Document No. 30 “Procedure to fit a new or updated classification method to the results of a completed Intercalibration Exercise” (EC, 2015 – 085).
Hydrology Summary Bulletin - September 2020
Year: 2020
Hydrology Summary Bulletin for September 2020 outlining flows in rivers, rainfall, lake levels and groundwater levels at a network of over 300 stations across Ireland.
Hydrology Summary Bulletin - August 2020
Year: 2020
Hydrology Summary Bulletin for August 2020 outlining flows in rivers, rainfall, lake levels and groundwater levels at a network of over 350 stations across Ireland.
Hydrology Summary Bulletin - July 2020
Year: 2020
Hydrology Summary Bulletin for July 2020 outlining flows in rivers, rainfall, lake levels and groundwater levels at a network of over 350 stations across Ireland.
Lake monitoring aquatic plants - Fact Sheet
This Plain English fact sheet outlines the work done by the EPA in monitoring aquatic plants in Irish lakes., July 2020
Year: 2020
Aquatic plants are good at showing if the quality of the water is good or bad and play an important role in lake ecology by providing food and a habitat for many smaller plants, animals and birds.
Hydrology Summary Bulletin - June 2020
Year: 2020
Hydrology Summary Bulletin for June 2020 outlining flows in rivers, rainfall, lake levels and groundwater levels at a network of over 350 stations across Ireland.
Hydrology Summary Bulletin - May 2020
Year: 2020
Hydrology Summary Bulletin for May 2020 outlining flows in rivers, rainfall, lake levels and groundwater levels at a network of over 350 stations across Ireland.