FAQs on climate change
-
What is global warming?
The earths climate has remained relatively stable for most of human history. This is evident from temperature records some of which date back to the mid-1800s and before this based on reconstruction from other records and measurements e.g. tree rings. Since about the middle of the 20th Century an increasing trend is evident in the global temperature record. This is frequently referred to as global warming, but the term can include other changes such as melting of ice and thermal expansion of the oceans which is a major contributor to sea-level rise.
-
What is the greenhouse effect?
The greenhouse effect is the name given to the process whereby the energy which has arrived from the Sun can warm the planet to temperatures well above those which would be expected if there was no atmosphere present. A very simplified explanation of how this works is as follows:
The Sun’s energy is either reflected back into space or passes through the atmosphere to be absorbed at the surface of the Earth. The absorbed energy warms the surface, producing thermal radiation, heating the atmosphere from below. On its way back to space, the thermal energy is captured by certain gases in the atmosphere, and this heats the atmosphere further. These gases are called greenhouse gases. This simple explanation is illustrated in the image below.
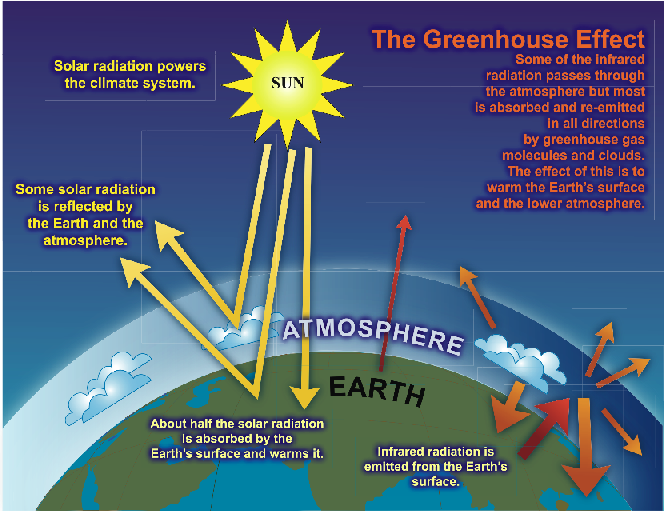
Greenhouse gases (ghg), although they constitute only a small fraction of the atmosphere, their impact on climate is very important. Without greenhouse gases, the Earth’s surface would have an average temperature of -18oC, too cold for life as we know it. Instead the average temperature at the surface of the Earth is approximately +15oC. Changing the atmospheric concentration of these greenhouse gases and other particles in the atmosphere can lead to a warming or cooling of the climate system.
The IPCC provides the detailed explanation of the Greenhouse Effect.
For more information on this topic, see Chapter 2: Observations: Atmosphere and Surface, of the IPCC 5th Assessment Report, Working Group 1, The Physical Science Basis (2013)
-
How do human activities contribute to climate change and how do they compare with natural influences?
Human influence on the climate system is clear. This is evident from the increasing greenhouse gas concentrations in the atmosphere, observed warming, and our current understanding of the climate system.
It is extremely likely that human influence has been the dominant cause of the observed warming since the mid-20th century.
Since the start of the industrial era (about 1750), the overall effect of human activities on climate has been a warming influence. The human impact on climate during this era greatly exceeds that due to known changes in natural processes, such as solar changes and volcanic eruptions.
For more information and further reading on this topic go IPPC Working Group 1 Annual Review 5 Summary for Policy Makers
-
What are the main sources of greenhouse gas emissions which have led to increased concentration in the atmosphere?
The increases in atmospheric carbon dioxide (CO2) and other greenhouse gases during the industrial era are caused by human activities. In all cases, atmospheric concentrations of greenhouse gases, and their increases, are determined by the balance between sources (emissions of the gas from human activities and natural systems) and sinks (the removal of the gas from the atmosphere by conversion to a different chemical compound).
Fossil fuel combustion (plus a smaller contribution from cement manufacture) is responsible for more than 75% of human-caused CO2 emissions. Land use change (primarily deforestation) is responsible for the remainder. For methane, agriculture and extraction of fossil fuels are the main sources.
For nitrous oxide, emissions are generated by industrial and agricultural activities. Most of the long-lived halogen-containing gases (such as chloro-fluorocarbons) are manufactured by humans, and were not present in the atmosphere before the industrial era.
Above taken from Chapter 7, IPCC 4th Assessment Report, Working Group 1, The Physical Science Basis (2007)
Further information
Chapter 6, IPCC 5th Assessment Report, Working Group 1, The Physical Science Basis (2013)
-
What is mitigation?
Mitigation in climate change is a human intervention to reduce emissions or enhance the sinks of greenhouse gases. In climate policy, mitigation measures are technologies, processes or practices that contribute to mitigation, for example renewable energy (RE) technologies, waste minimization processes, public transport commuting practices.
While mitigation measures to reduce greenhouse gas emissions have a certain cost they also constitute an economic benefit by reducing the impacts of climate change, and the costs associated with them. In addition, they may also bring economic benefits by reducing local air pollution and energy resource depletion.
Mitigation measures can also have other benefits for society, by not only improving human health, food security, biodiversity, local environmental quality, energy access, livelihoods, and equitable sustainable development but also providing cost savings from the negative impacts of climate change as well.
Further Information
IPCC Working Group 3 Annual Report 5 Annex
IPCC Working Group 3 Annual Report 5 Summary for Policymakers
-
What is adaptation?
Adaptation is the approach for addressing the current and future risks posed by a changing climate. Climate adaptation involves taking steps to adjust human and natural systems in response to existing or anticipated climatic change, in order both to avoid unwanted impacts and to take advantage of new opportunities that may arise. The National Adaptation Framework defines adaptation as 'a change in natural or human systems in response to the impacts of climate change. These changes moderate harm or exploit beneficial opportunities and can be in response to actual or expected impacts.
-
How is Ireland adapting to Climate Change?
Planning for a Climate Resilient Ireland, Ireland's first statutory National Adaptation Framework (NAF) was approved in 2018. The NAF sets out the national strategy to reduce the vulnerability of the country to the negative effects of climate change and to avail of any positive impacts. The NAF was developed under the Climate Action and Low Carbon Development Act 2015 and prepared in the context of the 2013 EU strategy on adaptation to climate change.
The NAF builds on the work already carried out under the 2012 National Change Adaptation Framework (NCCAF). The NAF outlines a whole of government and society approach to climate adaptation in Ireland. Under the NAF a number of Government Departments are required to prepare sectoral adaptation plans in relation to a priority area that they are responsible for. Local authorities are required to prepare local adaptation strategies. The NAF will be reviewed at least once every five years. The NAF also aims to improve the enabling environment for adaptation through ongoing engagement with civil society, the private sector and the research community.
The 12 priority sectors and all local authorities now have climate change adaptation plans and strategies in place. These were published in 2019 and will be reviewed at least once every five years.
Further Information
For more on national, sectoral and local adaptation see the Department of the Environment, Climate and Communications.
For more adaptation information and climate data see Ireland’s climate information platform, Climate Ireland.
-
What impacts of climate change have been observed and what is projected?
In 2018, the global temperature had been increased by 1.0°C relative to pre-industrial levels. At the current rate of warming, the world is expected to reach 1.5°C warming between 2030 and 2052 (IPCC, 2008). If this continues, the 2°C increase could occur around 2060. Globally the two main features of climate change are:
- changes in the rate of occurrence and scales of extreme weather events, such as heatwaves or rainfall events, and
- slow onset changes such as sea-level rise, loss of glaciers, and ecosystem changes.
For Ireland, by 2050 (mid-century) mean annual temperatures are projected to increase by between 1 and 1.2℃, and between 1.3 and 1.6℃ depending on the emissions trajectory. Heatwave events are expected to increase by mid-century and this will have a direct impact on public health and mortality. These changes may affect the life cycle (phenological) phases in many plant and animal species. By mid-century there are projected increases in both dry periods and heavy precipitation events, meaning we will have to consider increased flood risk as well as droughts. There is also the possibility that, although average wind speed may decrease, the intensity of individual storms may increase.
Building performance will be challenged by a changing climate, needing to cope with more extreme summer temperatures, intense rainfall events and potential changes in wind and storm patterns. This will require appropriate design and building standards, but also adaptation of existing building stock.
As our climate changes, it will create new conditions that may allow existing pests and diseases to spread and new threats to become established in Ireland. Our infrastructure systems are likely to be impacted by an increase in disruptive events and our water quality and supply might be affected.
Global mean sea level rise by 2100 is likely to be in the range of 0.29m to 1.10m (depending on the emissions scenario) and sea levels will continue to rise far beyond the year 2100.
Predicted changes in mean sea level will be magnified by changing storm surge and wave patterns in coastal areas. Sea level rise varies regionally but increasing sea levels around Ireland would result in increased coastal erosion, flooding and damage to property and infrastructure. High-resolution mid-century climate projections for Ireland were published by the EPA in 2020 and are available at Climate Ireland.
-
Can individual extreme weather events be explained by climate change?
Climate change is changing our weather patterns including the frequency and intensity of extreme events. However, it is not possible for science to state categorically that any specific individual extreme event is due to recent climate change, driven by human activities.
The comparison which can be drawn is the difference between an honest set of dice in a game and a loaded set. The loaded set is more likely to win, but on any specific throw of the dice it is very difficult for people watching to know that loaded dice are being used. Only after many games will it become clear that the dice are loaded and the somebody is cheating.
However, with climate change, we are in a better position than the poor gambler playing against loaded dice. Climate science has advanced to the stage where we can use our knowledge to build advanced models of the climate system. This allows us to compare the likelihood of a specific type of extreme event within the models with and without the influence of recent changes in climate. This is called ‘Climate Change Attribution’ and in recent years has allowed experts to make such as findings as the "Siberian heatwave of 2020 almost impossibel without climate change" and "...every heatwave analysed so far in Europe in recent years (2003, 2010, 2015, 2017, 2018, 2019) was found to be made much more likely and more intense due to human-induced climate change"
Further information