Groundwater originates as rainfall, or snow melt, which soaks through the soil to the underlying subsoil and bedrock. It flows through interconnected spaces or fractures in the subsoil or bedrock towards the streams, rivers, lakes or estuaries. During periods when there is little or no rain, almost all the water flowing in streams and rivers originates from groundwater.
Groundwater is used to supply water for drinking, agriculture and industry. It provides flow to wetlands and rivers and maintains healthy water ecosystems. Many human activities, if not managed properly, can lead to pollution of groundwater (e.g. pesticide spreading, chemical spills, leakage from septic tanks, and discharges).
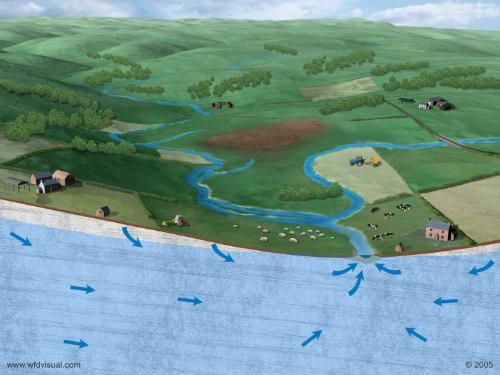
Groundwater flowing from areas of higher ground towards a river
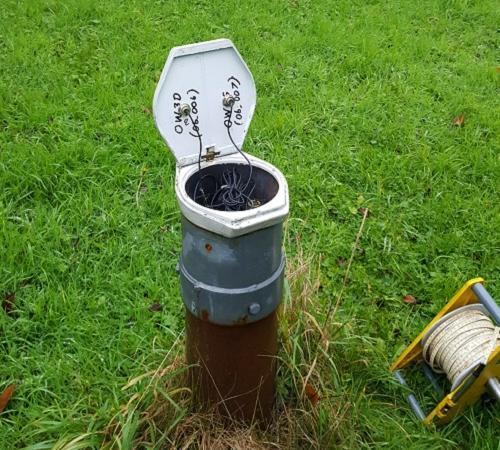
For the purposes of water management, groundwater in Ireland is assigned, assessed and managed within 514 groundwater bodies, which range in size from under 1 km2 to 1,887 km2.
The EPA’s national monitoring network is made up of approximately 330 groundwater monitoring stations. We monitor groundwater quality at 270 of these monitoring sites to determine the water quality status of the groundwater bodies. At around 150 sites, we monitor groundwater levels. These consist of springs or wells (which are correctly termed monitoring boreholes).
We regularly review the monitoring network, to ensure sites are representative of the water quality and water resources of Ireland. You can find more information on Ireland's National Water Framework Directive Monitoring Programme.
The EPA monitors both the quality and the levels of groundwater.
There are several physical and chemical parameters of groundwater quality that are measured in the field and laboratory.
These include:
| Parameters | |
|---|---|
| Standard Suite (tested 3 times a year) | pH, temperature, dissolved oxygen, conductivity, orp, coliform bacteria, e.coli, alkalinity, total hardness, colour, turbidity, total oxidised nitrogen (as N), ammonium, nitrite, nitrate, total phosphorus, ortho-phosphate, total organic carbon, silica, chloride, fluoride, sulphate, sodium, potassium, magnesium, calcium, iron, manganese, boron, aluminium, chromium, nickel, copper, zinc, arsenic, cadmium, antimony, barium, lead, uranium, mercury, cobalt, molybdenum, strontium, silver (stopped in 2013), beryllium, selenium, thallium, vanadium |
| Additional Suite (tested every 6 years) | pesticides, organic compounds (including PFAS), pharmaceutical compounds |
Groundwater chemistry data can be downloaded from the EPA Geoportal, in the section on ‘Water Quality and Monitoring’. Details of the groundwater monitoring network can also be downloaded there.
Recommended interim guideline values (IGV's) for the protection of groundwater in Ireland can be found in the EPA Groundwater Interim Report.
Groundwater levels are monitored every 15 minutes. You can view and download groundwater levels on EPA HydroNet.
Groundwater bodies are categorised as being either at ‘good’ or ‘poor’ status. The decision is based on five chemical tests and four quantitative tests. If one test fails, the overall groundwater status will be classed as ‘poor’.
You can find more information on methods and procedures used to assess the chemical and quantitative status of groundwater bodies in this EPA report.
Water Framework Directive data can be downloaded from the EPA Geoportal, in the ‘Water / Water Framework Directive’ section.
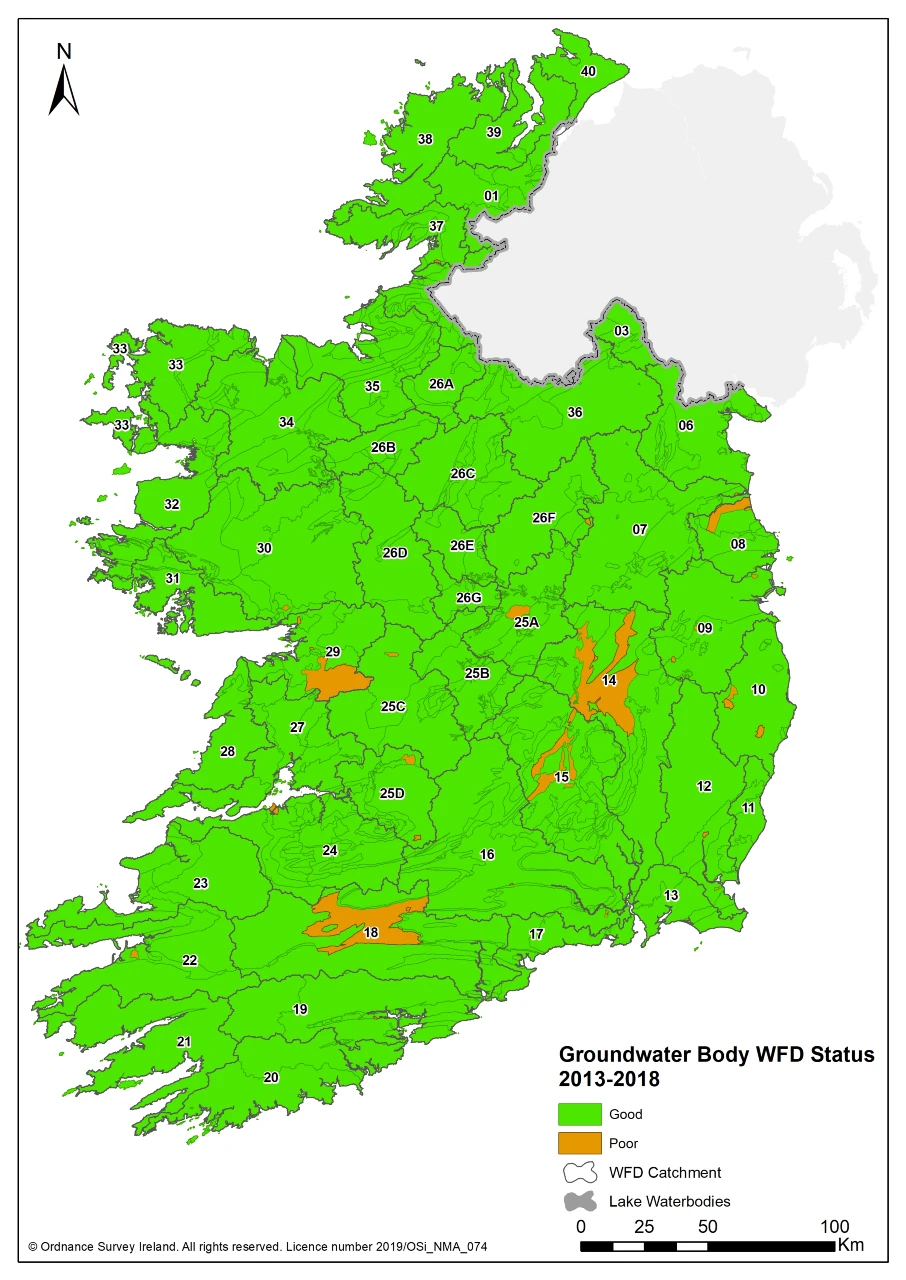
Overall, 91% of groundwater bodies are in good chemical status and nearly all are in good quantitative status. The south and southeast regions have the greatest proportion of sites with high and increasing nitrate concentration. There has been a slight decline of 0.8% (4 water bodies) in the number of groundwater bodies at good status since the last assessment.
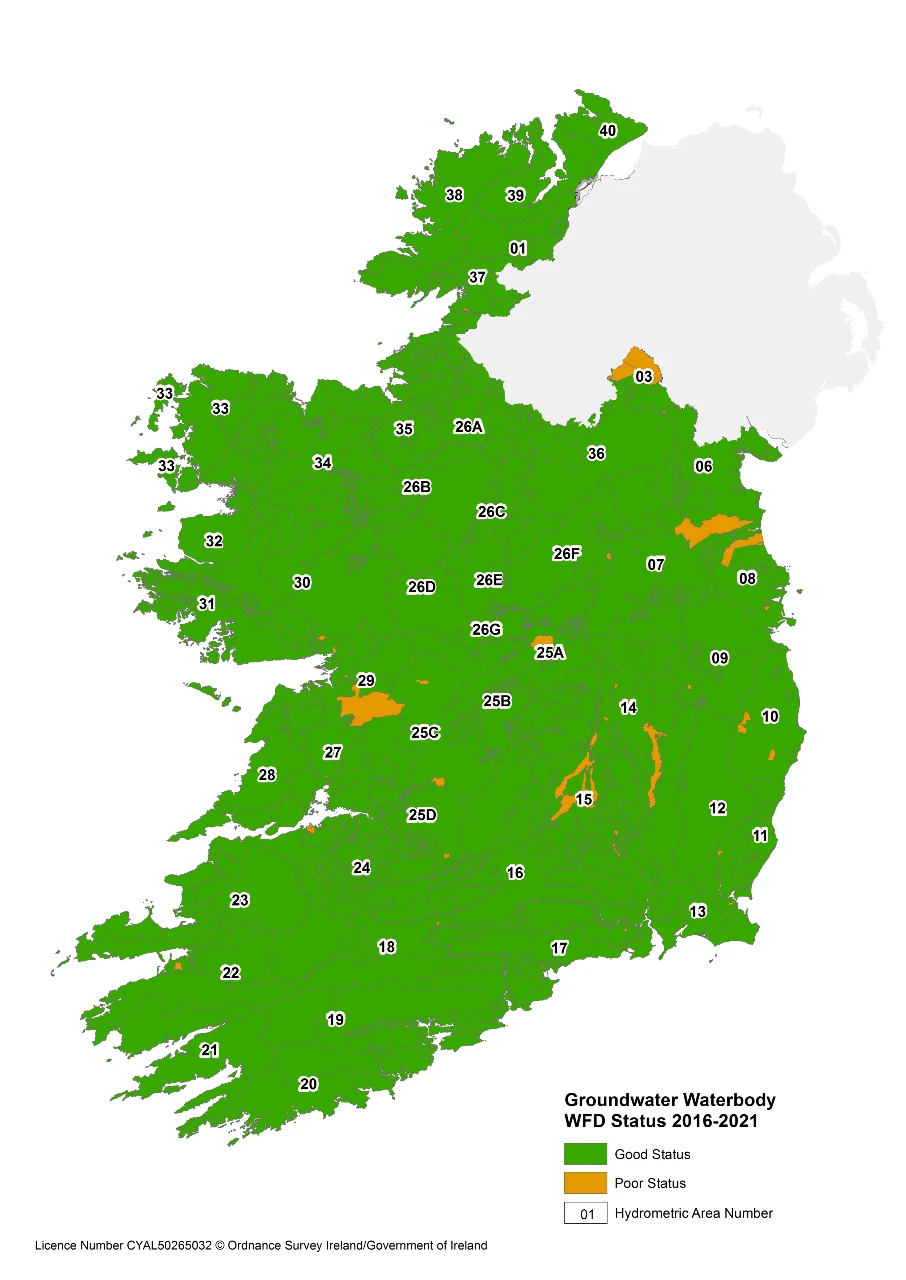
Groundwater Waterbody WFD Status 2016-2021
If you have your own well, learn more about protecting your private well.
You can also find more information about groundwater water quality in Ireland and the environmental pressures on these waters at Catchments.ie
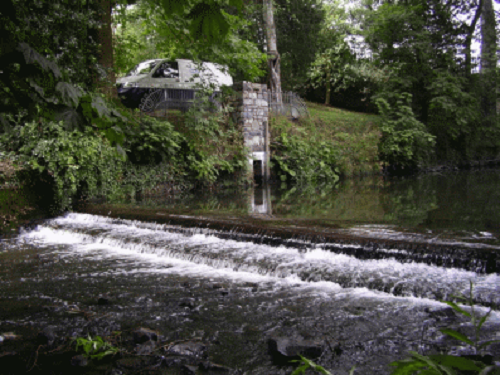
You can view a map and download hydrometric data collected at local authority hydrometric stations and processed by the EPA. HydroNet also contains information on stations operated by other organisations with links to their hydrometric data. It includes all active and historic (or inactive) hydrometric stations.
EPA Maps enables you to view environmental information interactively on a map. You can view locations of our groundwater monitoring network, and groundwater bodies and their status; and latest data on water quality on our EPA Maps.